
When I started playing the Pokémon TCG in early 2016, the world of resources available to competitive players was completely different than it is now. Many of the popular streamers we know in the scene today had not even ventured into content creation yet. I did not create PokéStats until the very end of that year, and, impossible as it seems now, Limitless did not exist until early 2017. The best thing we had in terms of data collection and statistical analysis in competitive Pokémon TCG was The Charizard Lounge's archives of Cities/States/Regional Day 2 results and metagame tables.
Now it's a few days from 2022, the competitive scene has been almost entirely online for nearly two years, and the amount of resources available to both new and experienced players has exploded relative to even a few years prior. The vast amounts of data produced by the Limitless Online Tournament Platform has dramatically changed the way we approach analysis of metagame evolution, and due to the ease of availability of lists (and the "hive-mind" nature of netdecking from content creators and top Limitless placements), top archetypes are "solved" relatively quickly relative to what we used to see.
Another, related change has come about with regard to how we track the progress and accomplishments of players in the online tournament scene, and who we think of as "top" players. With the "official" Championship Points (CP) system used by TPCI on hiatus for nearly two years with the physical tournament scene on pause, new attempts at creating global player rankings have arisen within the community. We hosted player rankings here on PokéStats for several formats in the past year, holding invitational tournaments for the Top 32 finishers for each format. Another ranking system that appeared in 2021 and has gained popularity recently is TrainerHill.
TrainerHill is possibly the best aggregation of competitive Pokémon TCG data we have seen to date: it pulls data directly from the Limitless Online Tournament Platform to provide a wealth of information on the metagame, card counts in decks, and even players' personal statistics such as top finishes and most played decks. One feature of TrainerHill is its leaderboard, which ranks online-tournament players by the amount of points they have earned, using a system somewhat similar to the old PokéStats system to assign points to players based on their placement and the size of the event. However, there are issues with this system. A number of small but important differences from the PokéStats system can affect how points are earned in a way that can skew the player rankings, and the statistics presented on the leaderboard page are not indicative of true player skill.
This article is not a takedown of TrainerHill! I use TrainerHill frequently, think it is an excellent resource, and have been in contact with its webmaster multiple times discussing potential changes. What I aim to do with this article is twofold: first, to suggest how TrainerHill might be able to better present the data it collects to create a better player-ranking system; and second, to encourage Pokémon TCG players to gain some statistical literacy and have a better idea of how to analyze data.
Unless otherwise noted, data cited in this article were collected and analyzed on 29 December 2021.
As I see it, these are the major issues with how data is currently presented on TrainerHill:
Issue 1: By default, players on the leaderboard are ranked by total points, not win percentage or mean points per event.
Using a cumulative measure rather than a summary statistic (such as mean points earned) means that the leaderboard is primarily a display of who plays the most online tournaments--not necessarily who is performing best in them.
On 27 December, I noted on Twitter that, at that time, 16 of the Top 25 points-earners on TrainerHill were also among the Top 25 players with the most online tournament games played. I also noticed that there were huge discrepancies between the highest and lowest win percentages and mean points per event among the Top 25 points-earners. These observations suggested to me that the TrainerHill rankings might not be sorting players primarily by their skill level (as determined by win percentage or mean points per event), but instead, primarily by whether or not they had played more events. This would be comparable to TPCI ranking players by Play! Points instead of CP.
I am not saying that all of the players at the top of the current leaderboard are bad players or don't deserve to be there. At the time of this writing, the Top 25 Fusion Strike points-earners on TrainerHill include a number of players with established success at physical tournaments, including at the Regional level and above, such as Le Bui, Evan Campbell, André Chiasson, Azul Garcia Griego, Grant Manley, and Joshua Sutherland. There are also a number of players who have consistently proven themselves among the top online players since the pandemic era began: Vini Fernandez, Jonathan Patricio, Kashvinder Singh, and Ricardo Toddy, to name a few.
However, the discrepancies among win percentage and mean points per event are quite large among these Top 25 players. Let's look first at win percentage.
Based on months of observation of online tournaments, I have noticed that the win percentage of established "top" players (e.g. Azul, Grant, Alex Schemanske) ends up around the mid- to high- 60s over the course of a format (I will discuss this more later in the article). Thus if the TrainerHill rankings accurately reflect player skill, we would expect most of the Top 25 players on the leaderboard to be in the vicinity of that mid-60s win percentage. Indeed, Azul and Grant (ranked 24th and 25th at the time of this writing) do have win rates of right around 65% for the Fusion Strike format. However, many more players in the Top 25 have win rates well below 60%.
As of 29 December, there was a range of 18.1 percentage points between the highest (70.3%) and lowest (52.2%) win percentages of the Top 25 points-earners. This is quite a huge range considering what we are looking at! (Remember, percentages are restricted between the values of 0 and 100, so that range covers almost one-fifth of all possible values, just among the Top 25 points-earners. Also consider that win rates more extreme than about < 30% or > 70% are likely to be extreme outliers or indicate small sample sizes.) 70.3% is an extremely impressive win rate for the Pokémon TCG (and that player had a sample size of almost 200 games), while the player with the 52.2% win rate was performing only negligibly better than a coin flip (with a sample size of over 400 games).
Next, we can examine the other statistic TrainerHill provides alongside total points and win percentage: mean points per event. As I'll demonstrate below, among Top 25 points-earners, I could identify very little correlation between a player's total points earned and their mean points earned.

Issue 2: There is no minimum event size to earn points.
TrainerHill sources all data from the Limitless Online Tournament Platform, and Limitless has no restrictions on who can serve as a tournament organizer and no standardization of tournament structure or timeframe. We've seen this system abused by players creating extremely small (often < 10 players) tournaments, often in the middle of the night, to boost their TrainerHill points by winning sometimes as few as two games.
When we created the PokéStats power rankings, we recognized that it would be important to establish a minimum event size for players to earn points. Because there were a lot more online tournaments being organized during the era of the PokéStats rankings, and thus more opportunities to play in large and credibly run tournaments on any given night, we established a cutoff of at least 50 players for an event to count towards our rankings. For TrainerHill's purposes, in the current state of the online tournament scene, I might suggest a minimum event size of 24 players. This has been an important number in Pokémon TCG (and especially for PokéStats) for the past few years because it is the attendance size that triggers a change from Top 4 to Top 8 earning CP at League Cups, and thus influenced the amount of data we were collecting from any particular Cup. I consider most online tournaments to be roughly equivalent to League Cups, and thus I'd suggest that a minimum attendance of 24 be implemented as a cutoff so that extremely small tournaments do not unduly influence players' point totals.
Alternatives to total point rankings: win percentage and mean points earned
I was careful above to specify that TrainerHill ranks its leaderboards by total points earned "by default"--you can sort the leaderboards by both win percentage and mean points by clicking the corresponding arrows next to each heading. However, there are some major flaws with this. TrainerHill does not set a minimum sample size (n) of games when calculating win percentage or mean points. This means that these statistics as they are provided in the current context of the site's leaderboards are almost useless.
As an example of what I mean, let's consider a player who makes Top 8 in a single 70-player event, with a record of 6-1-0 before cut and then a loss in Top 8 for an overall 6-2 record. On TrainerHill, that player will be entered into the leaderboards with a 75% win rate and, because their single event finish resulted in a Top Cut appearance, a high mean points per event. If this player never plays another tournament in that format, they will remain close to the top of TrainerHill's win percentage and mean points leaderboards, but we have no real idea of their skill from a sample size of one tournament. It's very possible that they are a strong player, but it's also possible that they were largely on the positive end of variance throughout that one tournament (they "ran hot"). Just as you can't draw serious statistical conclusions about a sports team's entire season from watching one game at random, you can't draw conclusions about a player's skill until you have a large sample size of tournament games. We even occasionally see players attain records like 3-0 drop, giving them a 100% TrainerHill win rate that is effectively a useless statistic.
Since TrainerHill does not allow you to filter results to show players with a sample size above a certain number of games, I had to analyze this manually. Below are two tables I tweeted recently in which I listed the Top 25 players by both win percentage and mean points per event on TrainerHill, but I restricted these only to players with an n of at least 30 tournament games played.
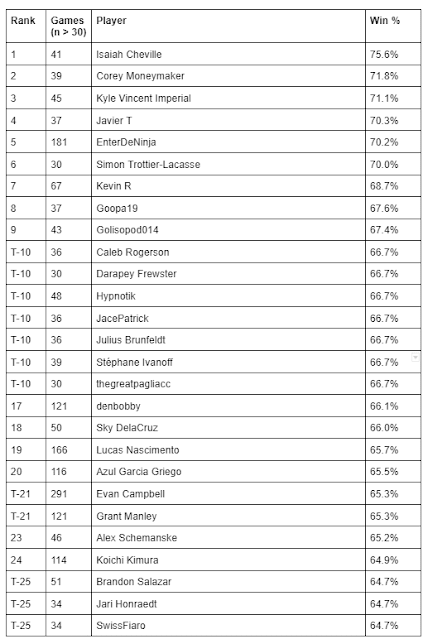

I am not suggesting that these are a perfect representation of the Top 25 online tournament players in the world. However, I am very confident that the summary statistics of win percentage and mean points per event are better indicators of player skill than total points is on its own. These two sets of rankings introduce more names you probably recognize from established physical-tournament success: Alec Geissler, Stéphane Ivanoff, Brandon Salazar, Alex Schemanske, Simon Trottier-Lacasse. Because a lot of the established "top" players from Regionals/ICs/Worlds rarely if ever play online tournaments (think Hunter Butler, Caleb Gedemer, Michael Pramawat, Brent Tonisson, Gustavo Wada, and many many more), we will probably never see an online-tournament player ranking that closely matches the global CP leaderboards. But there are plenty of "online" players who also deserve recognition for their success, either because they have only begun playing in the past two years, or because they have been good for longer and simply did not get many opportunities to show their skill in person. I want online-tournament leaderboards to be truly reflective of the best players competing online at any given time, not just the people playing the most events.
If you are knowledgeable about statistics, you probably noted my choice of n ≥ 30, and maybe felt that it seems somewhat arbitrary. If you questioned this, you raise a great point and one of the major questions I wanted to address in this article. Xander Pero messaged me to ask about this not long after my tweets went up; he thought I'd used a sample size of 30 because of the Central Limit Theorem.
Briefly, the Central Limit Theorem (CLT) is a principle in statistics that states that the means of random samples from a population will approximate a normal distribution as you take more and more samples. (You can read more about it here.) If the population you're sampling from is itself normally distributed (the data form a "bell curve"), the CLT holds true regardless of how large your samples are. But if the population has a skewed distribution, you need a minimum sample size of n ≥ 30 for the CLT to apply. Xander correctly pointed out that adhering to the CLT with win-loss data might not work out, because win-loss data may not follow a normal distribution. (You can read more about that here.) (I also didn't take a random sample; I selectively sampled the highest-ranking players.)
In actuality, I wasn't thinking of the CLT when I chose 30 for my minimum sample size of games; I was thinking of (roughly) how many total games you would play if you played in three randomly selected online tournaments. My logic: because of the variance of the Pokémon TCG, a weak player could perform well in one tournament as a fluke, and two tournaments as an even less likely fluke, but if you do well in three tournaments, you're probably at least a decent player. Thus I figured three tournaments worth of games would be a strong enough sample size to evaluate player skill, and this is very roughly approximated by my chosen sample size of n ≥ 30 games.
There are flaws with this logic too, though. It is still an arbitrary cutoff point. Someone with 29 games played but a win percentage in the high 60s would be excluded from the above rankings despite being apparently a strong player. But it seems almost impossible to determine a "fair" cutoff for the sample size of games. How many games is too few games to properly assess player skill?
I mentioned earlier that I have noticed something of a pattern regarding win percentage among the established top players. Players such as Evan Campbell, Azul Garcia Griego, Stéphane Ivanoff, Grant Manley, and Alex Schemanske (to pull from the above tables) have win rates of about 65-66%. I estimate that over the course of many tournaments (i.e. over an entire format), this mid-to-upper-60s range is probably the upper limit of what can be achieved in terms of win percentage in online tournaments, just because this game contains so much variance and even these top players will occasionally have bad tournaments that drag their percentage down.
Each of Evan, Azul, and Grant have an n of well over 100 games played for this format; however, as of 27 December, Alex had 46 and Stéphane only 39. I will keep watching Alex and Stéphane's progress throughout the rest of this format as they continue to increase their sample size, but I would expect their win rates to stay fairly constant around that 65-66% mark as they approach the sample sizes attained by Evan, Azul, and Grant. Considering Stéphane's n = 39, does this support my decision of around 30 games being a viable sample size for assessing player skill, or should something like that 100-point barrier be considered instead, or is there a compromise point between those two? Obviously, we need a much larger sample size than five players, so this is a topic to continue thinking about and testing. However, it seems clear to me that if we want to establish a more accurate online-tournament player ranking system, some kind of conclusion will need to be reached (if not by me, or by TrainerHill, then by Stéphane, Xander, or someone else with an interest in this area) about what the appropriate n should be for games played.
Another skill-indicator statistic: mean percentile finish
Another valuable statistic I think TrainerHill could try to include is a player's mean percentile finish across events. Your percentile for any given event simply shows what percentage of players finished better than you. For example, if I place 16th in a 100 player event, I could say I was in the top 16% of players for that event. I calculate my percentile for every tournament I play in my own tournament data spreadsheets and use some simple Google Sheets formulas to auto-update my mean percentile finish across all events in a format. Currently, my mean percentile for Fusion Strike Standard says that, on average, when I play in an event this format I finish in about the top 23% of players.
Because the Pokémon TCG is a game involving variance, even the absolute best players in the world have occasional events where they go 0-3 drop, 2-4 drop, etc., so everyone's mean percentile will be dragged down somewhat by those poor finishes. The top 1% most skilled players in the world should not have a mean percentile finish of 1%; that would be almost impossible, implying they were probably making the finals of literally every event they played. Rather, a high mean percentile finish simply shows that the top players are going 0-3 drop, 2-4 drop, etc. less frequently than most players, and making Top Cut more frequently than most players. With that context, I would estimate that the world's best players may have a mean percentile finish around the high teens.
I like mean percentile finish as a skill-indicator statistic because it shows exactly how well a player performs on average across a number of events, and in fact it becomes more accurate the more events one plays. If you divide your events into periods of time such as months or formats, you may even be able to see your skill increasing if your mean percentile finish increases across periods. I set a goal for myself to reach a mean percentile finish of 20% for any given format (for the past few formats I have been right around that, in the low 20s). The correct way to read this statistic is not "You are better than 80% of players;" it is "in your theoretical average tournament, you will finish better than 80% of players." If your mean percentile finish is 20%, you are actually probably a lot better than "the top 20% of players!" Sometimes I go 0-3 drop (etc.), but more frequently I perform well or even make it to Top Cut, which is why my mean percentile is much higher than 50% (the percentile you would expect if all of your games and tournaments were decided completely by luck). If your mean percentile finish is below 50%, you are likely being outskilled by average-level opponents in most tournaments, or you are frequently making poor metagame reads with your deck choices.
If you want to steal one of my spreadsheet templates or learn how to calculate your own mean percentile finish, feel free to message me on Twitter.
Conclusions
"And if I ever strangled sparrows, / it was only because I dreamed of better songs."
Saeed Jones
Talking about player rankings and even the online tournament scene in general can be a touchy subject. No one wants to feel like their skill or accomplishments are being questioned, and in this article I have potentially brought those topics into question for many players. Since the "COVID era" of Pokémon TCG began, I think I have been one of the stauncher defenders of "online players" in the community, often repeating the refrain that "if you're consistently good online, I have no reason to believe you can't also be consistently good in person." (While there are of course differences between online and physical play, such as open vs. closed lists, clock management, the mental game, and more, at the heart of it we are playing the same game whether it's PTCGO or real cards, and most of the same techniques and strategies apply to gameplay in both mediums.) I don't intend to belittle anyone's accomplishments when I write about topics such as "player skill" from an objective perspective.
My goal with this article was to encourage people to use critical thinking when examining datasets; for example, is total points really the best way to track player skill objectively, or are the other methods I showed better suited? TrainerHill gives you a vast amount of data--how do you use that data for the best possible purpose, whether that's metagame prediction, deckbuilding, or setting goals for accomplishments as a competitive player? Familiarizing yourself with the concepts I discuss in this article will benefit you in this game one way or another. As Stéphane Ivanoff illustrated to much acclaim in his recent article, Pokémon TCG is fundamentally a game about understanding probability; but, within the sub-topics of metagaming and player-ranking, it's about statistics too.
If you have further questions, suggestions, or just want to talk Pokémon, I am always free to chat @twhitesell42.
Until next time!
Correction: Previously, I incorrectly gave 24 as the attendance to trigger a Top 8 cut at League Cups; I meant to write that 24 is the kicker for Top 8 to earn CP. Top 8 is triggered by an attendance of 21 players. Thanks Thomas Happel!